Core concept
Rated capacity is the nominal battery size.
A 1,000 Wh label is the starting point, not a promise that 1,000 Wh reaches your device.
Rated capacity is the nominal battery size.
Usable capacity is what remains after losses and reserve.
Measured capacity records are stronger than calculator estimates when the source is clear.
Portable power stations and solar generators usually advertise nominal battery watt-hours. That number is useful for comparison, but it is measured before delivery losses and user reserve.
The calculator reduces nominal Wh by the output path efficiency, reserve kept unused, battery health, and temperature loss before dividing by the load.
When a third-party source publishes delivered Wh for the same model and output path, use that record as a reality check and keep unknown test conditions visible.
This calculation is hypothetical, not a test of a named station. Change one assumption at a time. Keep reserve and output path the same when comparing, and use input watts rather than an appliance’s output rating.
Estimated runtime: 19.1h
1,000 × 0.85 × 0.90 ÷ 40 = 19.1
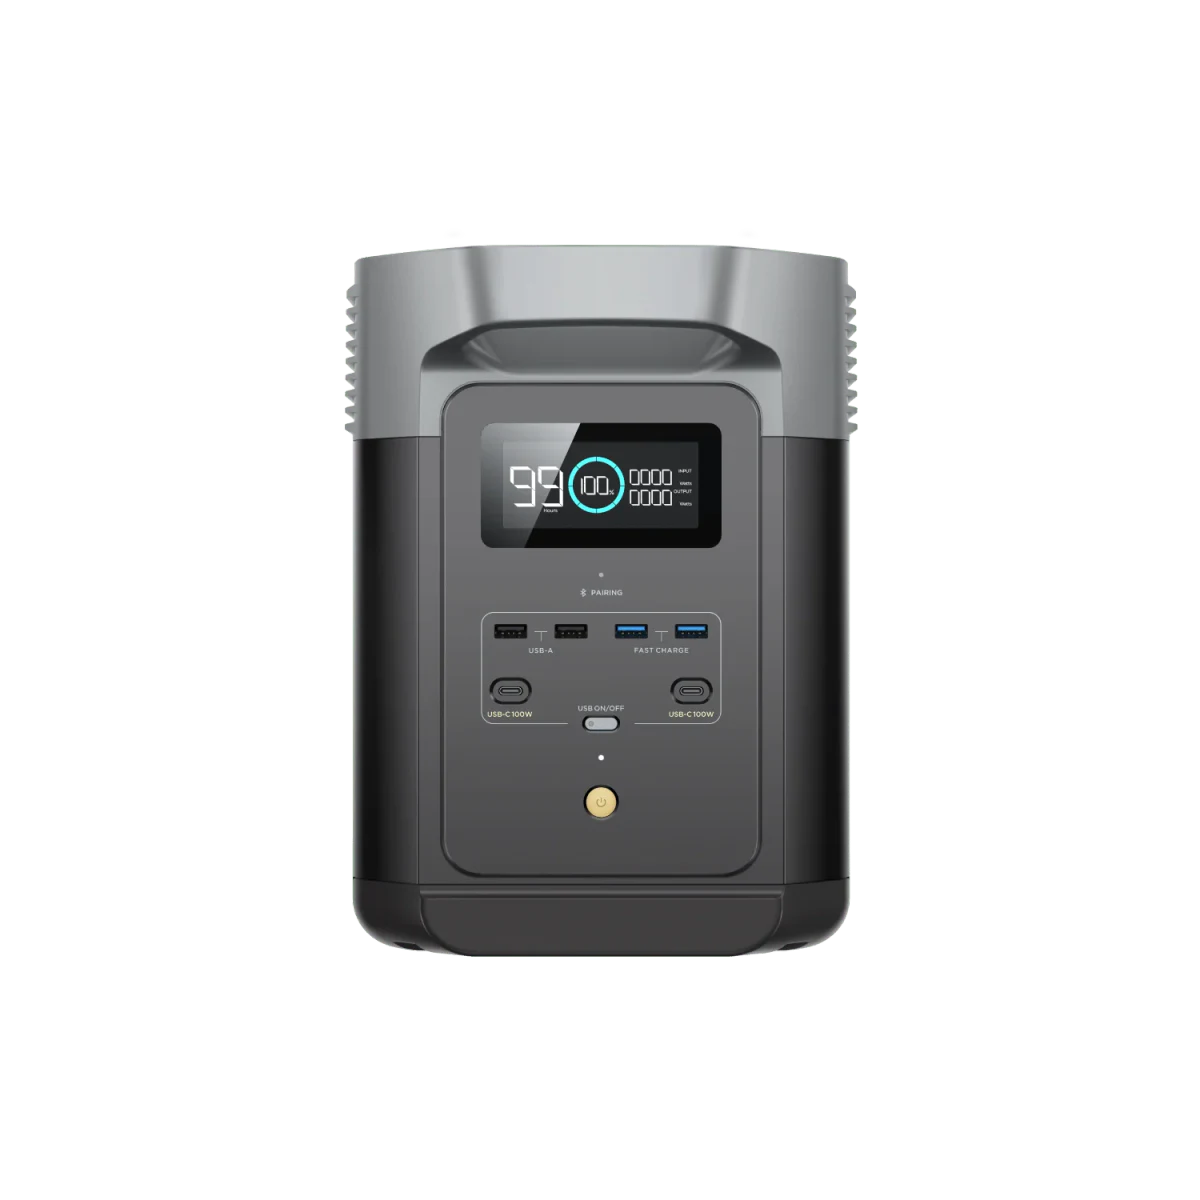
The same publisher reports different delivered energy for the same model at low and high AC loads. Read each Wh value together with its load and duration. The approximate watts cannot reconstruct the separately measured Wh and hours. Do not transfer the 380 W result to a router or CPAP setup.
Third-party results apply to the listed model, output path and test load. The delta is against a fixed no-reserve planning formula, not an error score or a prediction at other loads. Missing test conditions remain unknown.
| Test | Measured | default planning estimate | Vs estimate | Source |
|---|---|---|---|---|
| Runtime test (AC) Average test load: ~380 W test date unknown | 900 Wh 88% | 870 Wh | +30 Wh (+3%) | Outdoor Life Best Portable Power Stations of 2026 2026-01-09; accessed 2026-09-04 |
| Runtime test (AC) Average test load: ~34 W test date unknown | 690 Wh 67% | 870 Wh | -180 Wh (-21%) | Outdoor Life Best Portable Power Stations of 2026 2026-01-09; accessed 2026-09-04 |
These are attributed third-party observations, not our hardware tests. Small continuous loads may deliver fewer Wh because an inverter remains active for longer. Efficiency also varies with load. Reported Wh and approximate watts × rounded hours need not agree; preserve the source's readings. Do not infer an inverter wattage from their difference.
| Model | Below 100 W | 100 W or more | Difference at higher load |
|---|---|---|---|
| EcoFlow DELTA 2 outdoorlife.com | ~34 W · AC 690 Wh (67.4%) | ~380 W · AC 900 Wh (87.9%) | +210 Wh |
Same model, output and source series; temperature, battery endpoints and individual test dates remain unknown. These observations show a load association, not a controlled proof of its cause. Delivered Wh already include losses: do not subtract efficiency or overhead again.
Outdoor Life attributes this AC inverter-and-port column to manufacturer replies. It is not an independently reproduced battery-side measurement. Load, interval, temperature and battery endpoints are unknown; these figures are not applied automatically in our calculator. Unavailable stays unknown. Recheck your exact setup before entering fixed overhead.
| Model | Reported draw | Observation checked |
|---|---|---|
| EcoFlow DELTA 2 | 10 W · AC | Outdoor Life · 2026-09-30 |
These sources support the definitions and planning method. Calculator results are still estimates, not measurements or guarantees.
WattRunTime publishes source-based editorial calculations. We do not claim to have laboratory-tested these products or to provide medical or certified engineering review. Sources support specific statements; automated checks validate structure and arithmetic, not product truth. Third-party measurements name their publisher.
Open the calculator and change efficiency, reserve, health, or temperature to see why two stations with the same Wh label can plan differently.
Something blocked the calculator from starting. Check your connection or reload the page to try again.
Estimated runtime
Within the tracked power limits; compatibility still needs checking
This is an estimate. Real runtime changes with load, temperature, battery age, AC/DC output, and device behavior. Runtime is conditional on successful startup, compatible voltage/connectors and sufficient output. Verify the actual device setup before relying on these hours.
13h 3mEstimated runtime: 13h 3mThis setup has comfortable headroom for overnight use, assuming the wattage estimate is realistic.
These are calculated sensitivity cases, not a statistical confidence interval. Conservative uses lower efficiency and battery health, more reserve/temperature loss and higher load; optimistic changes these assumptions in the opposite direction.
Rated Wh is reduced by efficiency, reserve, battery health, and temperature before it is divided by average load.
This link contains the numeric values you entered, but not custom load names.
WattRunTime.com
Estimated runtime
13h 3mThis setup has comfortable headroom for overnight use, assuming the wattage estimate is realistic.Rated Wh is reduced by efficiency, reserve, battery health, and temperature before it is divided by average load.
Share URL
Related Guides
Apply this guide's assumptions in the runtime calculator.
Turn battery capacity and voltage into a usable-energy plan.
Turn the required runtime into a capacity target with margin.
Turn the required runtime into a capacity target with margin.
Compare calculated estimates with attributed delivered-energy tests.
Efficiency guide
AC is convenient, but the inverter changes battery energy into wall-style power and some energy is lost as heat.
Margin guide
A runtime plan is safer when it leaves margin for age, cold, changing load, and measurement error.
Learn why rated watt-hours are not the same as usable watt-hours after inverter losses, reserve, battery health, and temperature.
For real device output, yes. Reserve, conversion losses, battery health, cold weather, and device behavior reduce the energy available to the load.
Use measured Wh when it matches the model and output path. If the load, temperature, or test conditions are unknown, keep the result as a planning estimate.